Core Concepts#
In the previous section, we delved into building a simple app. A Panel app like this makes exploration of various visualizations very easy, supporting types such as Matplotlib, Bokeh, Plotly, Altair, DataFrame, and various text and image types.
Now, let’s explain the core concepts of Panel.
Development Flow#
As you gear up to develop your Panel application, you’ll encounter a couple of initial decisions to make regarding approach and environment:
Programming Approach: Will you opt for a Python function-based approach or a class-based approach?
The function-based approach is recommended for new and basic users. It utilizes
pn.bind, as you’ve already experienced while building a simple app.The class-based approach is recommended for intermediate Panel users who aim to construct larger and more maintainable apps, as well as reusable components.
Interested in a class-based approach instead?
Explore the same ‘outlier’ app built using a class-based declarative API. Study the Explanation > APIs section for a detailed discussion on each of the API options.
Development Environment: Will you develop in a notebook or in an editor environment?
If you’re unsure, starting in a notebook is recommended as you familiarize yourself with Panel. However, you can switch between them at any time.
Notebook#
In a notebook, you can swiftly iterate on individual components of your application because Panel components render inline. To get started in a notebook, simply import panel and initialize the extension with pn.extension().
import panel as pn
pn.extension()
By placing a Panel component at the end of a notebook cell, it renders as part of the output. You can then modify the code and re-run the cell to iterate and build the individual units of your final application. This iterative approach offers many benefits, enabling you to work on each component independently without re-running your entire application each time.

To add Panel components to your app, mark them as .servable() and serve the app with:
panel serve app.ipynb --dev
You’ve already experimented with this while building a simple app.
Editor#
If you’re working in an editor, declare the Panel components you want to display as .servable(), then serve the script with:
panel serve app.py --dev --show
Upon running that command, Panel launches a server that serves your app, opens a tab in your default browser (--show), and updates the application whenever you modify the code (--dev).

Tip
We recommend installing watchfiles to get the best user experience when using --dev flag.
Tip
Explore How-to > Prepare to Develop for more guidance on each development environment option.
Control Flow#
Panel operates on a powerful framework called Param, which governs how information flows within your app. When a change occurs, such as the value of a slider or a manual update in your code, events are triggered for your app to respond to. Panel provides various methods for setting up this interactivity. Understanding the basics of Param is crucial to mastering Panel. However, it’s not necessary to get started as a new, basic user.
So, what exactly is Param? It’s a framework that enables Python classes to have attributes with defaults, type/value validation, and callbacks when values change. You can liken it to other frameworks like Python dataclasses, Pydantic, and Traitlets.
Reactivity is a key concept in both Param and Panel. This means changes in one part of your app can automatically update other parts. Think of it like Excel, where altering one cell can prompt updates in cells that reference it. Param objects operate similarly.
In Panel, understanding the distinction between a Parameter’s value and the Parameter object itself is important. The value represents the current value at a specific moment, while the object contains information about the Parameter and serves as a reference to its value over time. In many cases, you can utilize a Parameter object, and Panel will handle updating the value reactively as it changes. For instance, consider a widget:
text = pn.widgets.TextInput()

text.value  # 👈 The current value of the widget
text.param.value  # 👈 A reference to the "value" Parameter, used in Panel to bind to the "value"
We’ll delve deeper into this later. For now, remember that parameter objects (whether associated with widgets or not) enable you to pass around a reference to a value that automatically updates if the original value changes.
Display and Rendering#
Panel aims to seamlessly integrate with all your favorite Python libraries and automatically infer how to render a particular object, whether it’s a DataFrame, a plotting Figure, or any other Python object. This means you can effortlessly place any object you want to render into a layout (such as a Row or Column), and Panel will automatically determine the appropriate Pane type to wrap it. Different Pane types know how to render different objects but also provide ways to update the object or even listen to events such as selection of Vega/Altair charts or Plotly plots.
Hence, it’s often advantageous to understand the Pane type. For instance, to wrap your DataFrame into a pane, you can call the panel function, which will automatically convert it (this is precisely what a layout does internally when given an object to render):
import pandas as pd

df = pd.DataFrame({
  'A': [1, 2, 3, 4],
  'B': [10, 20, 30, 40]
})

df_pane = pn.panel(df)
Tip
To inspect the type of an object, simply print it:
>>> print(pn.Row(df))
Row
    [0] DataFrame(DataFrame)
At times, an object may have multiple possible representations to choose from. In such cases, you can explicitly construct the desired Pane type. For example, here are a few representations of a DataFrame:
pn.pane.DataFrame(df)
| A | B | |
|---|---|---|
| 0 | 1 | 10 |
| 1 | 2 | 20 |
| 2 | 3 | 30 |
| 3 | 4 | 40 |
pn.pane.HTML(df)
| A | B | |
|---|---|---|
| 0 | 1 | 10 |
| 1 | 2 | 20 |
| 2 | 3 | 30 |
| 3 | 4 | 40 |
pn.pane.Str(df)
   A   B
0  1  10
1  2  20
2  3  30
3  4  40
Learn More
Discover more about Panes in the Component Overview - Panes section.
So far, we’ve learned how to display data. However, to actually incorporate it into your served application, you also need to mark it as .servable(). Marking an object as servable adds it to the current template, something we’ll delve into later. You can either mark multiple objects as servable, which adds them to the page sequentially, or you can use layouts to arrange objects explicitly.
df_pane.servable()
Widgets#
To craft an interactive application, you’ll typically add widget components (such as TextInput, FloatSlider, or Checkbox) to your application and then bind them to an interactive function. For example, let’s create a slider:
import panel as pn

x = pn.widgets.IntSlider(label='x', start=0, end=100)

def square(x):
    return f'{x} squared is {x**2}'

pn.Row(x, pn.bind(square, x))
The pn.bind function allows us to bind a widget or a Parameter object to a function that returns an item to be displayed. Once bound, the function can be added to a layout or rendered directly using pn.panel and .servable(). This enables you to express reactivity between widgets and output very easily.
Reminder
Recall our discussion on the difference between a Parameter value and a Parameter object. In the previous example, the widget itself effectively serves as an alias for the Parameter object, i.e., the binding operation is exactly equivalent to pn.bind(square, x.param.value). This holds true for all widgets: the widget object is treated as an alias for the widget’s value Parameter object. Thus, you can generally pass either the widget (as a convenient shorthand) or the underlying Parameter object.
While the binding approach above works, it can be somewhat heavy-handed. Whenever the slider value changes, Panel will recreate a whole new Pane and re-render the output. For finer control, we can instead explicitly instantiate a Markdown pane and pass it bound functions and Parameters by reference:
import panel as pn

x = pn.widgets.IntSlider(label='x', start=0, end=100)
background = pn.widgets.ColorPicker(label='Background', value='lightgray')

def square(x):
    return f'{x} squared is {x**2}'

def styles(background):
    return {'background-color': background, 'padding': '0 10px'}

pn.Column(
    x,
    background,
    pn.pane.Markdown(pn.bind(square, x), styles=pn.bind(styles, background))
)
Templates#
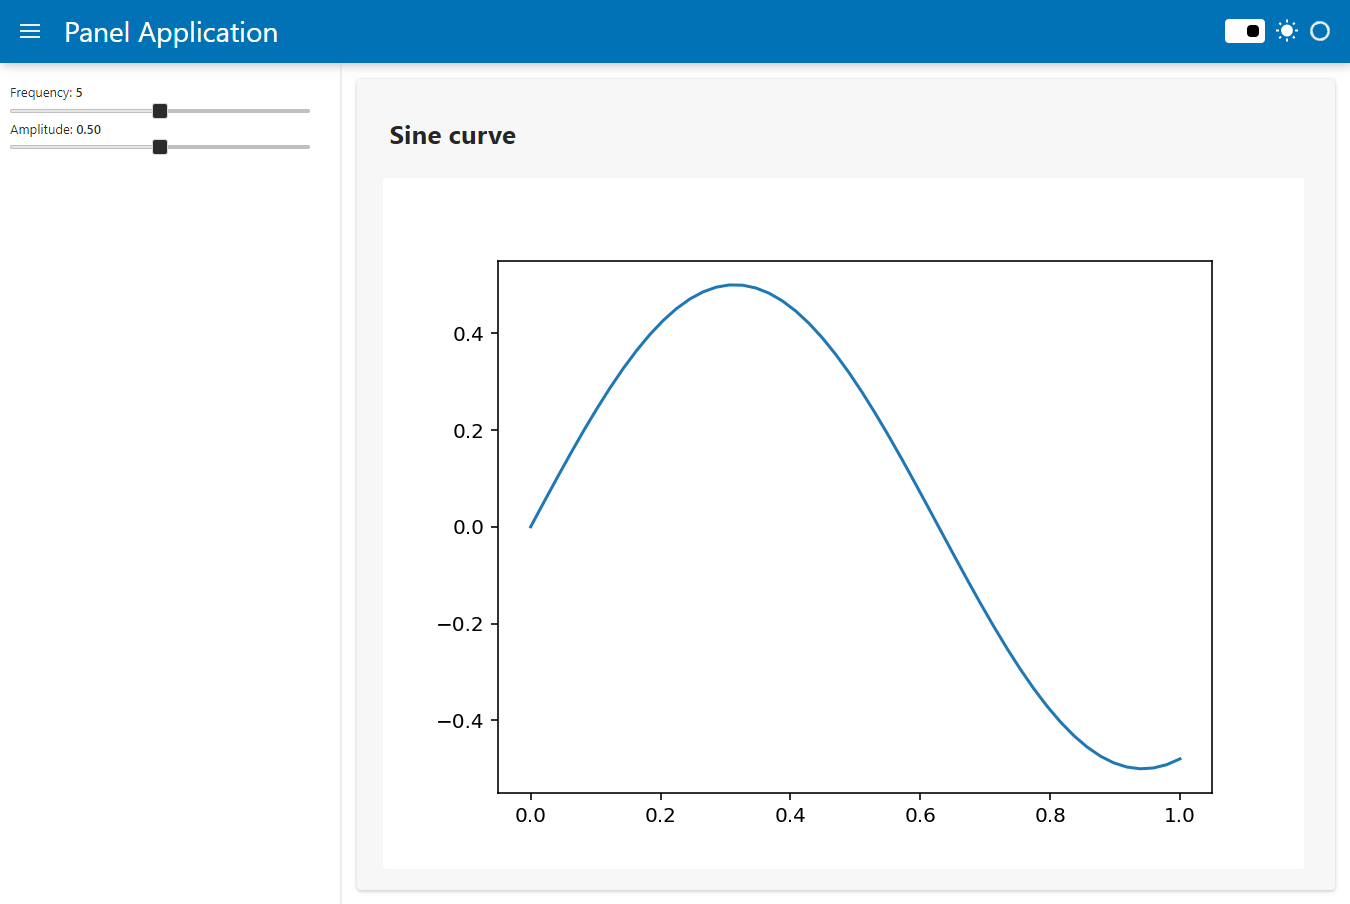
Once you’ve begun building an application, you’ll likely want to enhance its appearance, which is where templates come into play. When you mark an object as .servable(), you’re inserting it into a template. By default, Panel employs a completely blank template, but selecting another template is straightforward by setting pn.config.template. You’ll have several options based on different frameworks, including 'bootstrap', 'material', and 'fast'.
pn.config.template = 'fast'
Note
The pn.config object offers a range of options to configure your application. As a shortcut, you may provide options for the config object as keywords to the pn.extension call. In other words, pn.extension(template='fast') is equivalent to pn.config.template = 'fast', providing a clean way to set multiple config options at once.
Once you’ve configured a template, you can control where to render your components using the target argument of the .servable() method. Most templates feature multiple target areas including ‘main’, ‘sidebar’, ‘header’, and ‘modal’. For example, you might want to render your widgets into the sidebar and your plots into the main area:
import numpy as np
import matplotlib.pyplot as plt
import panel as pn

pn.extension(template='fast')

freq = pn.widgets.FloatSlider(
    label='Frequency', start=0, end=10, value=5
).servable(target='sidebar')

ampl = pn.widgets.FloatSlider(
    label='Amplitude', start=0, end=1, value=0.5
).servable(target='sidebar')

def plot(freq, ampl):
    fig = plt.figure()
    ax = fig.add_subplot(111)
    xs = np.linspace(0, 1)
    ys = np.sin(xs*freq)*ampl
    ax.plot(xs, ys)
    return fig

mpl = pn.pane.Matplotlib(
    pn.bind(plot, freq, ampl)
)

pn.Column(
    '# Sine curve', mpl
).servable(target='main')
Next Steps#
In this Getting Started guide, you’ve installed Panel, built a simple app, and explored core concepts, laying the basic groundwork to start using Panel for your projects.
For a hands-on approach to learning Panel, dive into our Tutorials. If you seek clarity or wish to deepen your understanding of specific topics, refer to the Explanation section of the docs.
During Panel usage, consult the Component Gallery reference guides, find solutions to specific problems in the How-to guides, or explore the API Reference sections for technical specifications and descriptions.
Getting Help#
Explore the Panel Community page for all options to connect with other users and the core developers.

