Slides#
Open this notebook in Jupyterlite | Download this notebook from GitHub (right-click to download).
The SlidesTemplate is a simple extension of the basic template that uses the reveal.js presentation framework to present the published outputs as a set of slides. It is a list-like variant where the main area acts like a list-like container, but unlike other list-like templates, the individual items are published as separate slides (unless marked as a fragment).
Basic Templates#
For a large variety of use cases we do not need complete control over the exact layout of each individual component on the page, as could be achieved with a custom template, we just want to achieve a more polished look and feel. For these cases Panel ships with a number of default templates, which are defined by declaring four main content areas on the page, which can be populated as desired:
header: The header area of the HTML pagesidebar: A collapsible sidebarmain: The main area of the applicationmodal: A modal area which can be opened and closed from Python
These four areas behave very similarly to other Panel layout components and have list-like semantics. This means we can easily append new components into these areas. Unlike other layout components however, the contents of the areas are fixed once rendered. If you need a dynamic layout you should therefore insert a regular Panel layout component (e.g. a Column or Row) and modify it in place once added to one of the content areas.
Templates can allow for us to quickly and easily create web apps for displaying our data. Panel comes with a default Template, and includes multiple Templates that extend the default, which add some customization for a better display.
Parameters:#
In addition to the four different areas we can populate, the default templates provide some additional parameters:
busy_indicator(BooleanIndicator): Visual indicator of application busy state.collapsed_sidebar(str,default=True): Whether the sidebar (if present) is initially collapsed.header_background(str): Optional header background color override.header_color(str): Optional header text color override.logo(str): URI of logo to add to the header (if local file, logo is base64 encoded as URI).site(str): Name of the site. Will be shown in the header. Default is ‘’, i.e. not shown.site_url(str): Url of the site and logo. Default is “/”.title(str): A title to show in the header.theme(Theme): A Theme class (available inpanel.template.theme)sidebar_width(int): The width of the sidebar in pixels. Default is 330.
reveal.js parameters#
The SlideTemplate which is based on reveal.js, has some additional parameters:
reveal_config(dict): The reveal.js config options to applyreveal_theme(str): The reveal.js theme to apply (one ofblack | white | league | beige | night | solarized | simple)show_header(bool,default=False): Toggles the header on and off. Since slides rarely need a header the default is False and title and logo are rendered at the bottom of the slides.
In this case we are using the SlidesTemplate, built on top of reveal.js. It differs slightly from other templates, so we will start by setting up the code and then go through the template configuration step-by-step.
import hvplot.pandas
import numpy as np
import panel as pn
import pandas as pd

pn.extension(design=pn.theme.Material)

xs = np.linspace(0, np.pi)

freq = pn.widgets.FloatSlider(label="Frequency", start=0, end=10, value=2)
phase = pn.widgets.FloatSlider(label="Phase", start=0, end=np.pi)

widgets = pn.WidgetBox(freq, phase, horizontal=True)

def sine(freq, phase):
    return pd.DataFrame(dict(y=np.sin(xs*freq+phase)), index=xs)

def cosine(freq, phase):
    return pd.DataFrame(dict(y=np.cos(xs*freq+phase)), index=xs)

dfi_sine = hvplot.bind(sine, freq, phase).interactive()
dfi_cosine = hvplot.bind(cosine, freq, phase).interactive()

plot_opts = dict(responsive=True, min_height=400)
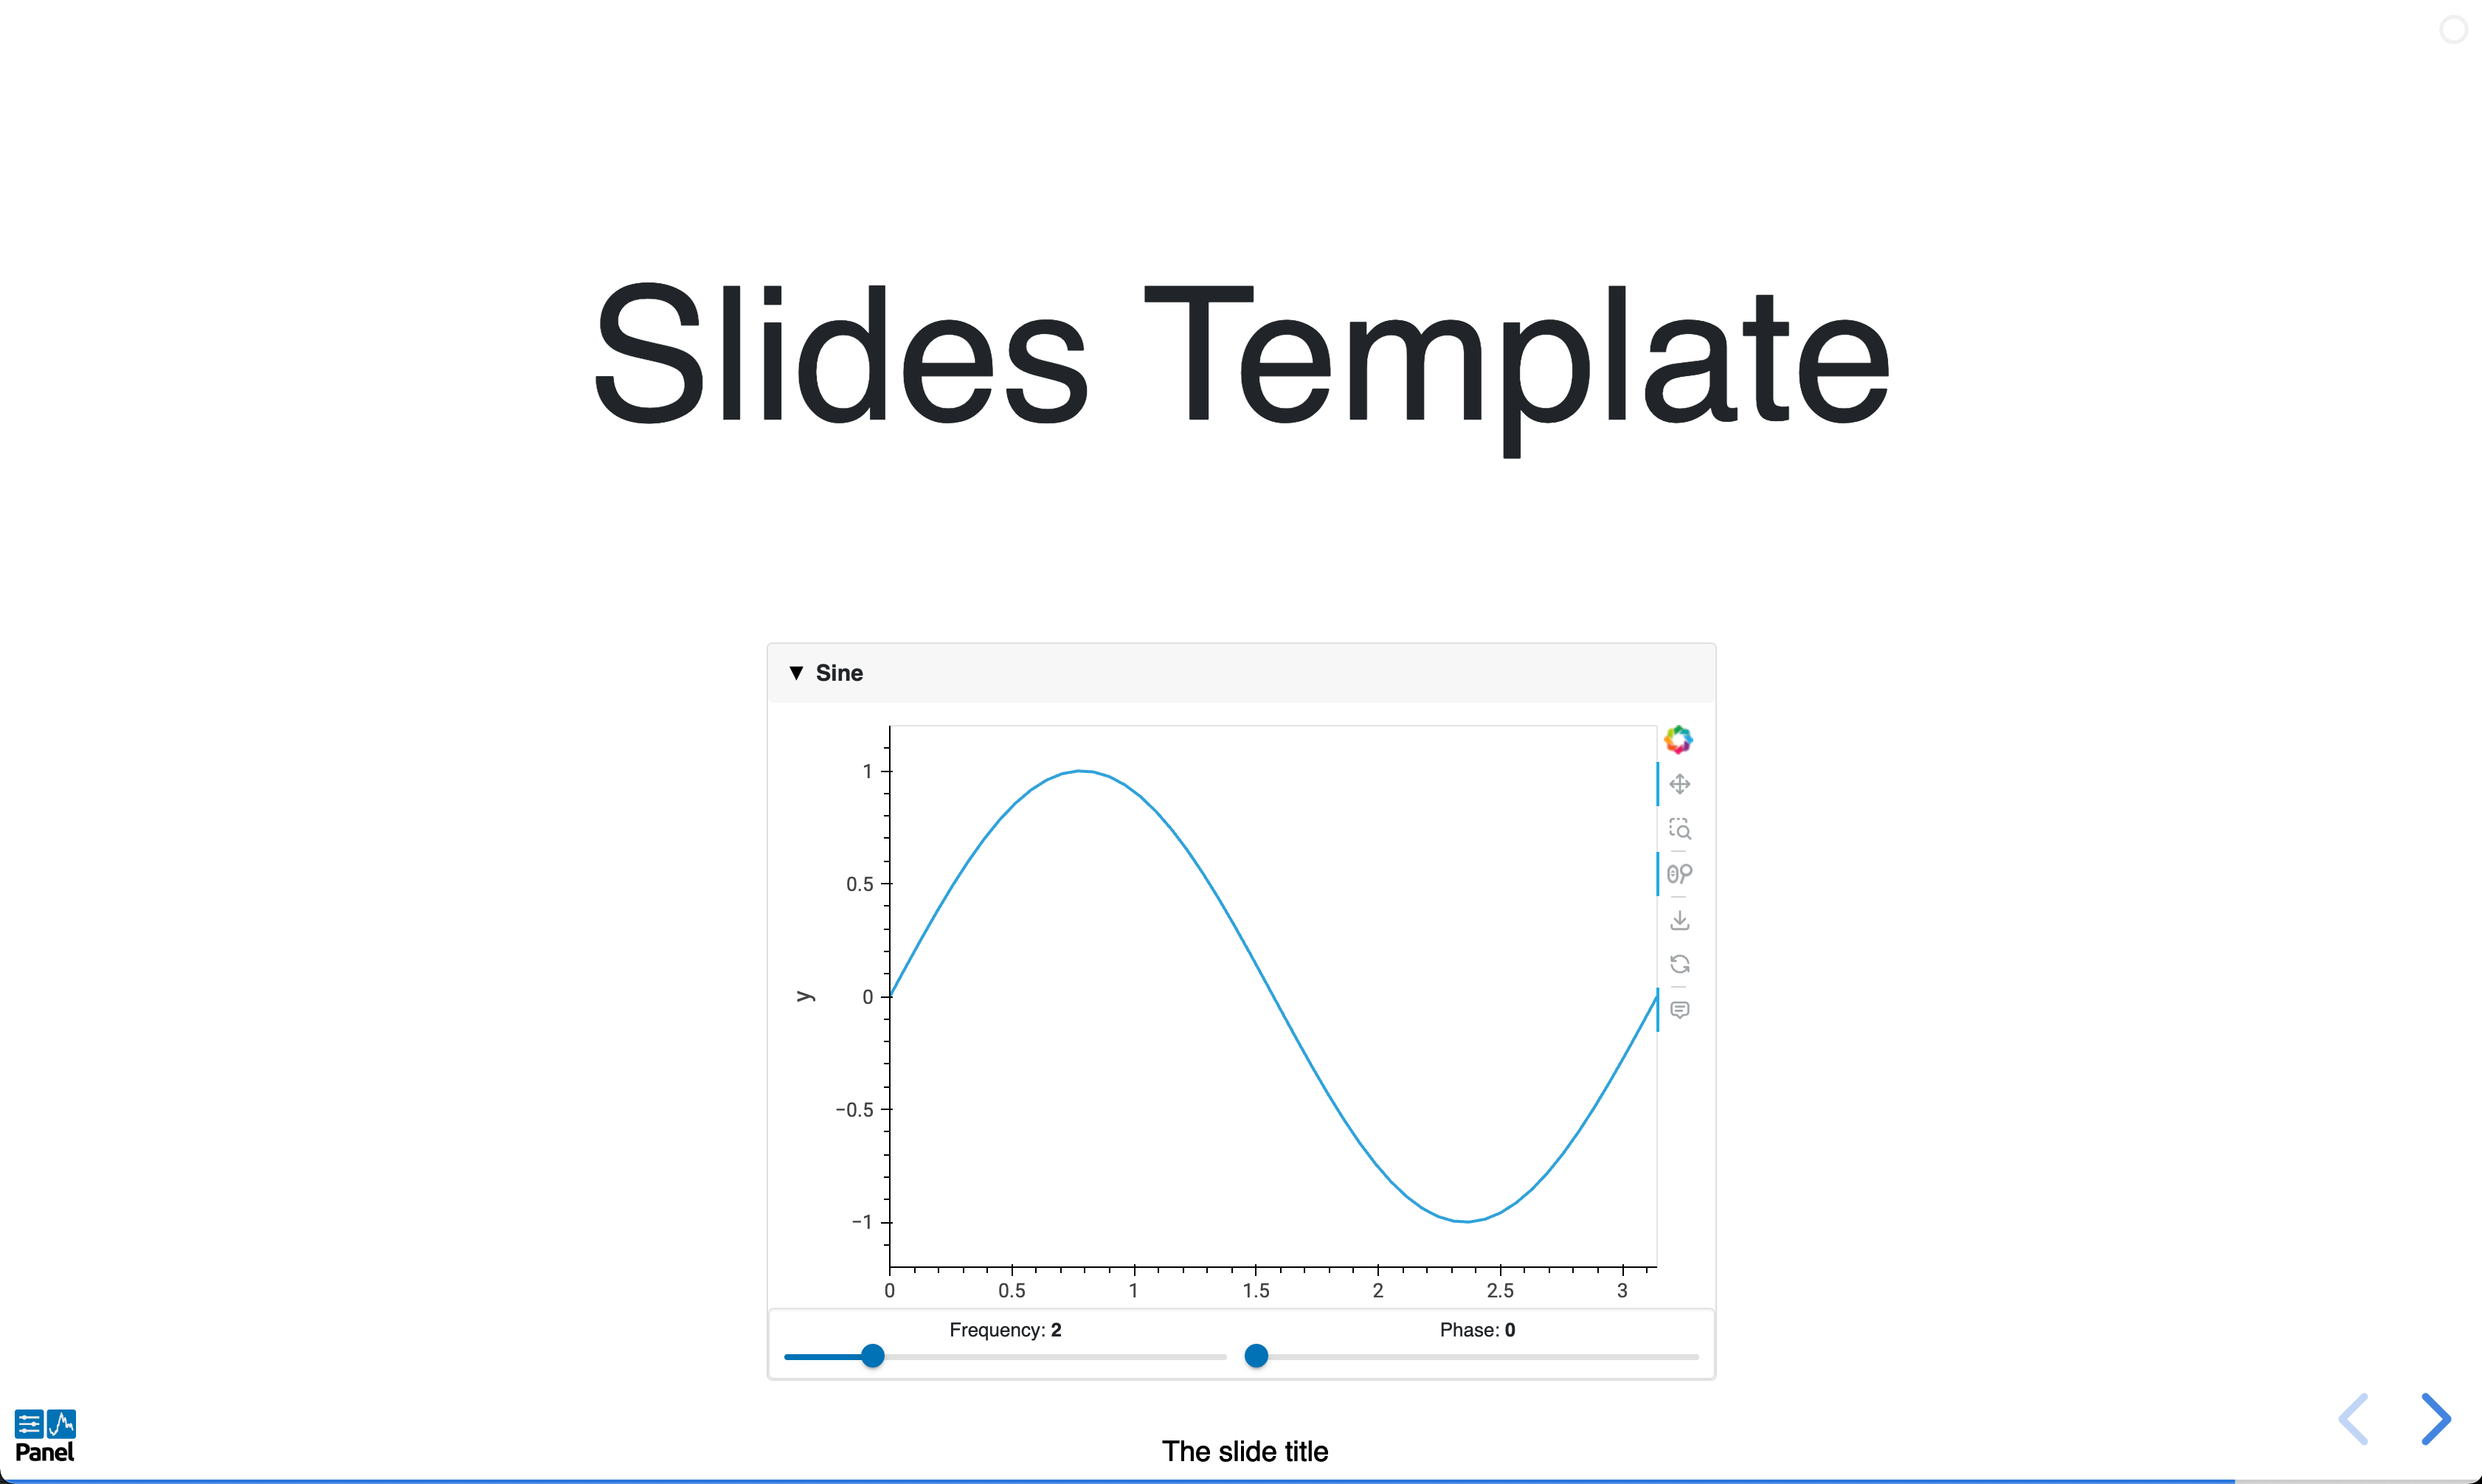
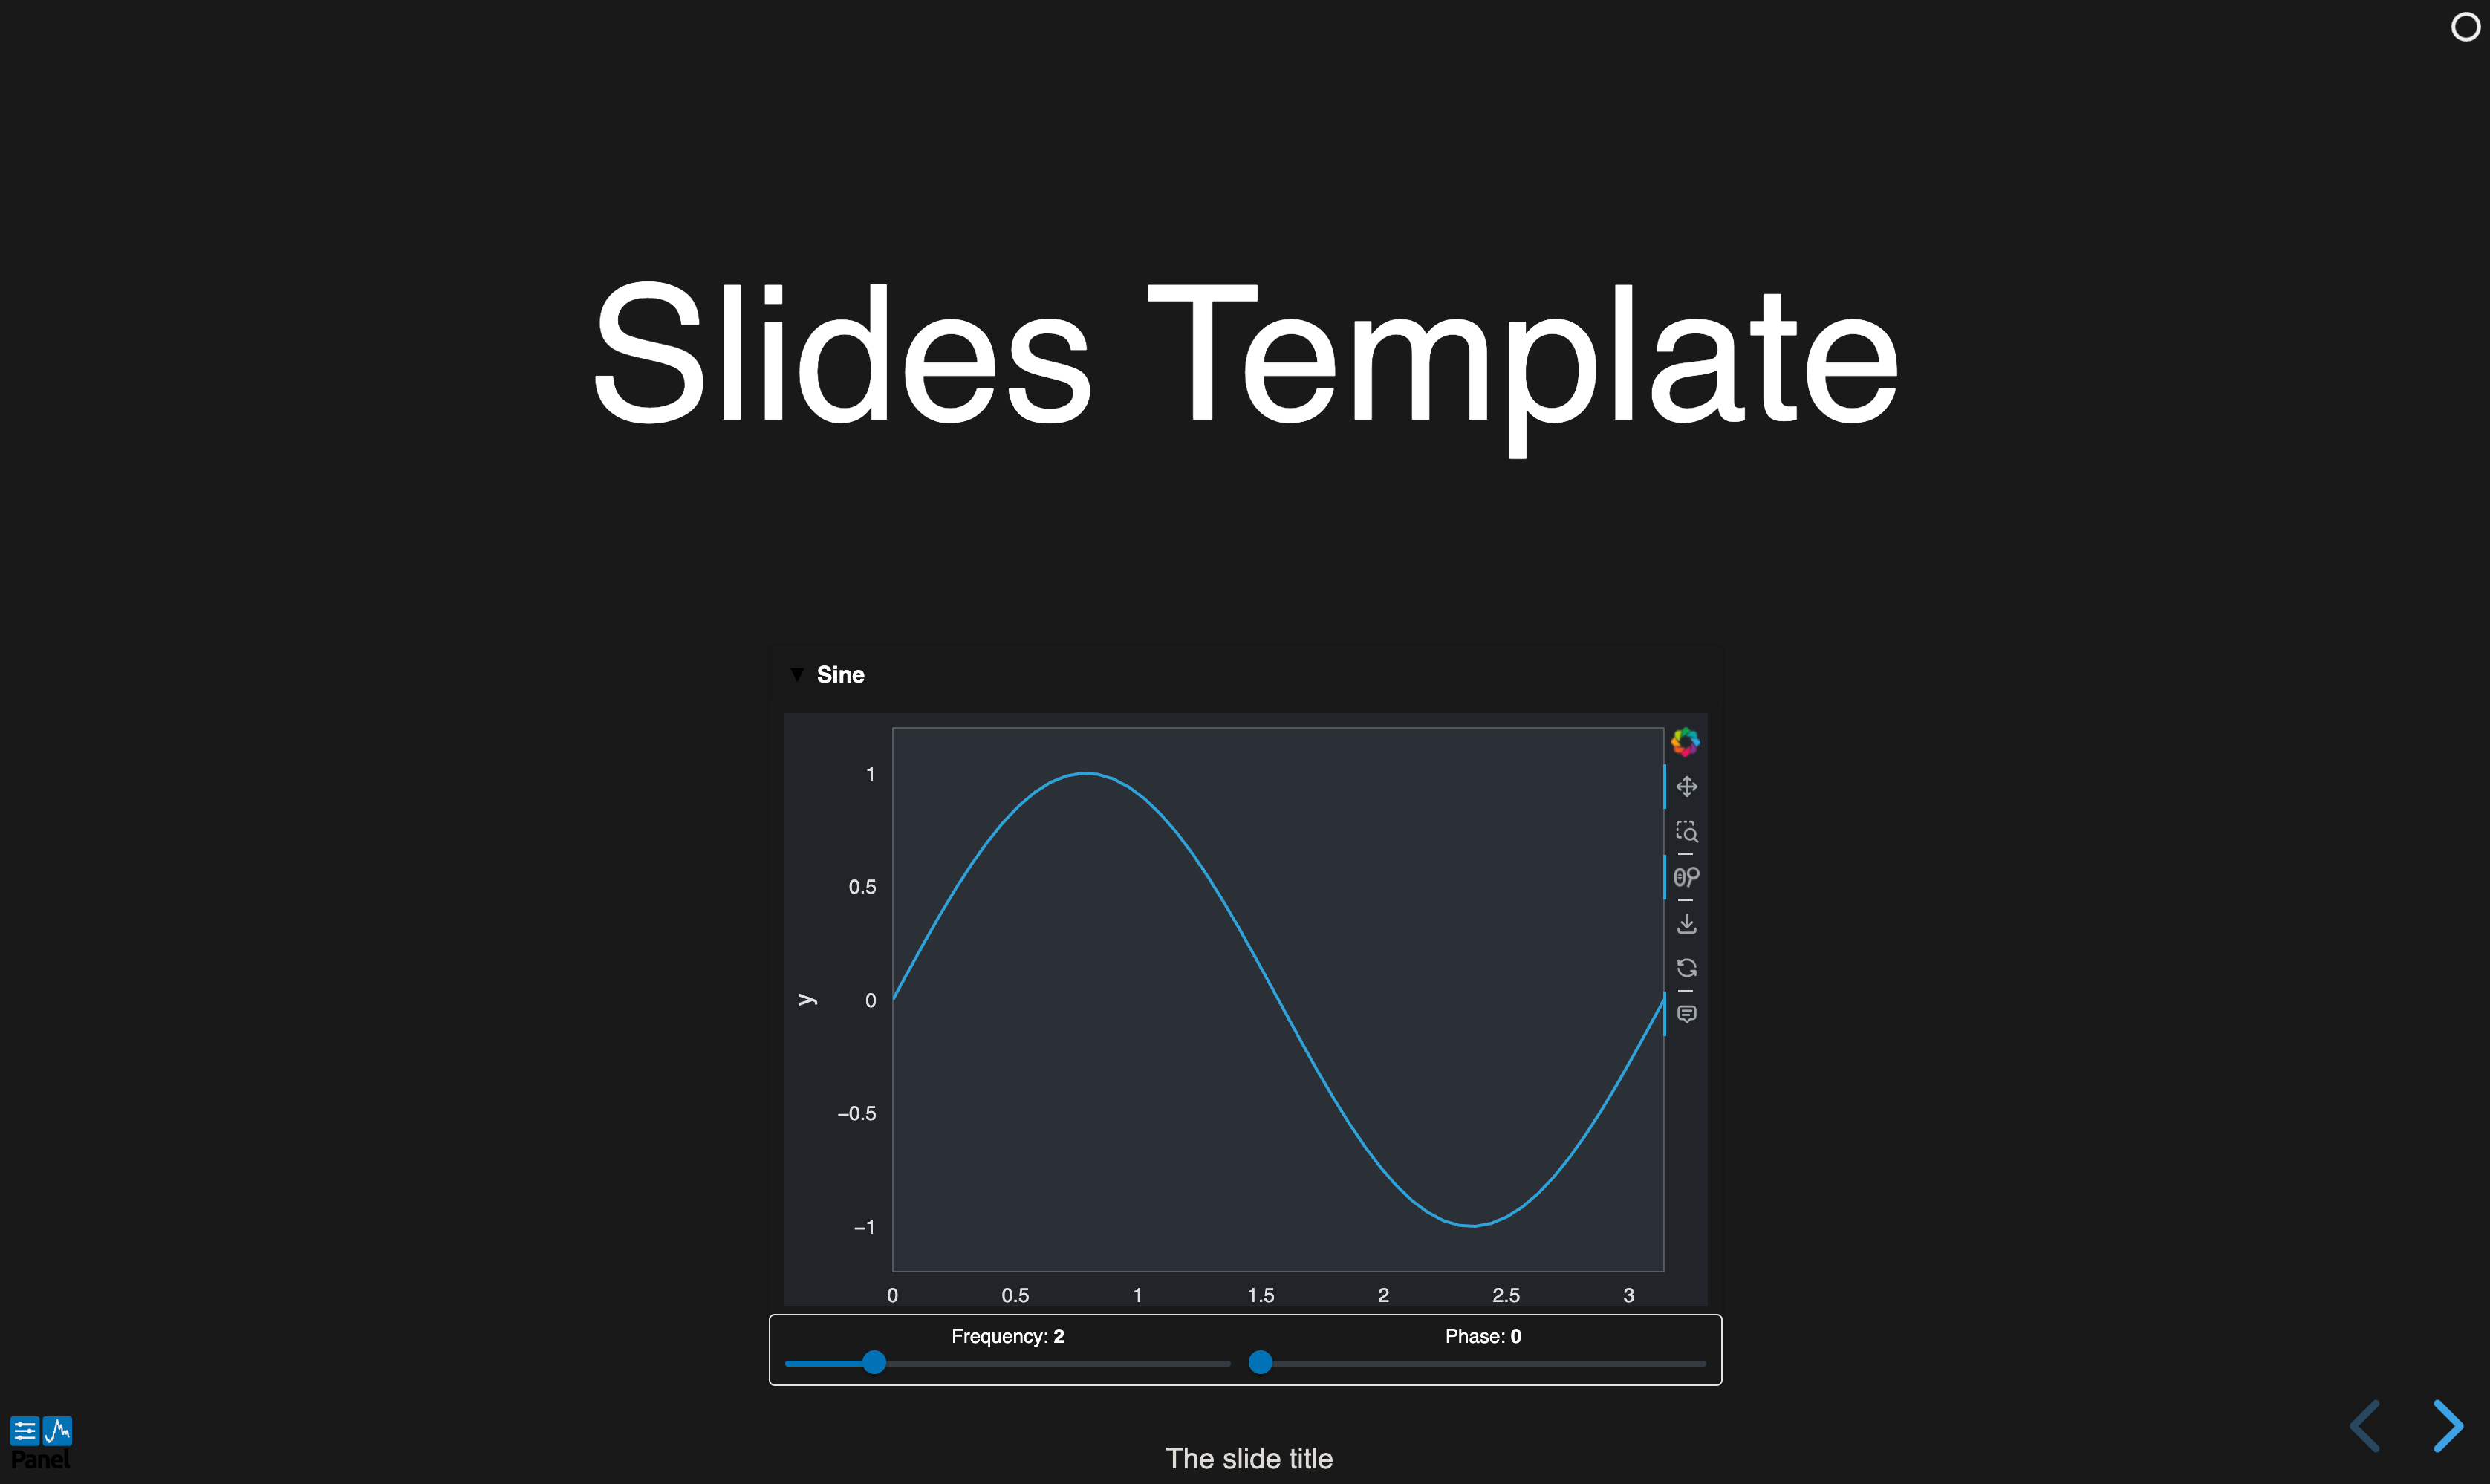
By default the SlidesTemplate will not render a header and instead render the title and logo at the bottom of the template. If you do want a header you can enable it with show_header=True. Additionally, unlike other templates, if added, the sidebar is hidden by default.
template = pn.template.SlidesTemplate(
    title='The slide title', logo='https://raw.githubusercontent.com/holoviz/panel/main/doc/_static/logo_stacked.png'
)
When adding to the template each new root added to the main area will add a new slide. However, if you want to add multiple fragments to the same slide (revealed as you advance slides) then you can add a tags=['fragment'] to a component:
template.main.extend([
    pn.pane.Markdown('Slides Template', styles={'font-size': '3em'}, align='center'),
    pn.Card(dfi_sine.hvplot(**plot_opts).output(), widgets, title='Sine', margin=20, tags=['fragment']),
])
We will add two slides to our template:
template.main.append(
    pn.Card(dfi_cosine.hvplot(**plot_opts).output(), widgets, title='Cosine', margin=20),
)

template.servable();
Each built-in template comes with a light (default) and dark theme. The theme can be set when instantiating the template with the theme parameter, or globally. Unless set explicitly it can also be toggled by adding ?theme=dark or ?theme=default to the URL.
SlidesTemplate with DefaultTheme
SlidesTemplate with DarkTheme
Tip
Built-in templates don’t render necessarily well in a notebook as their styling can badly interact with the notebook built-in styling. You can disable rendering the output of a cell using ;, as done above. For development purposes, the app can be quickly rendered in another tab by replacing .servable() with .show(). Alternatively, the JupyterLab Preview can be used to display objects marked with .servable() in a new JupyterLab tab, circumventing any potential styling issue.
Open this notebook in Jupyterlite | Download this notebook from GitHub (right-click to download).

