Perspective#
Open this notebook in Jupyterlite | Download this notebook from GitHub (right-click to download).
import panel as pn
import pandas as pd
import numpy as np
import random
from datetime import datetime, timedelta

pn.extension('perspective')
The Perspective pane provides a powerful visualization component for large, real-time datasets built on the Perspective Project. Perspective brings excel-like capabilities to your data app. Check out the Perspective Examples Gallery for inspiration.
The Perspective pane is a very good alternative to the Tabulator widget.
Parameters:#
For details on other options for customizing the component see the layout and styling how-to guides.
aggregates(dict): Aggregation spec, e.g. {x: “distinct count”}columns(list or dict): List of column names to display or a dictionary with column configuration options.columns_config(dict): Column configuration allowing specification of formatters, coloring and a variety of other attributes for each column.editable(bool, default=True): Whether items are editable.expressions(list): List of expressions, e.g.['"x"+"y"']filters(list): A list of filters, e.g.[["x", "<", 3], ["y", "contains", "abc"]].group_by(list): List of columns to group by, e.g.["x", "y"]object(dict or pd.DataFrame): The plot data declared as a dictionary of arrays or a DataFrame.plugin_config(dict): Configuration for the PerspectiveViewerPluginplugin(str): The name of a plugin to display the data. For example'datagrid'or'd3_xy_scatter'.selectable(bool, default=True): Whether rows are selectablesettings(bool, default=True): Whether to show the settings panel.sort(list): List of sorting specs, e.g.[["x", "desc"]]split_by(list): A list of columns to pivot by. e.g.["x", "y"]theme(str): The theme of the viewer, available options include'pro','pro-dark','monokai','solarized','solarized-dark'and'vaporwave'title(str): Title for the Perspective Viewer.
Callbacks#
on_click: Allows registering callbacks which are givenPerspectiveClickEventobjects containing theconfig,column_namesandrowof the clicked item.
The Perspective pane renders columns of data specified as a dictionary of lists or arrays and pandas DataFrames:
Basic Examples#
data = {
    'int': [random.randint(-10, 10) for _ in range(9)],
    'float': [random.uniform(-10, 10) for _ in range(9)],
    'date': [(datetime.now() + timedelta(days=i)).date() for i in range(9)],
    'datetime': [(datetime.now() + timedelta(hours=i)) for i in range(9)],
    'category': ['Category A', 'Category B', 'Category C', 'Category A', 'Category B',
             'Category C', 'Category A', 'Category B', 'Category C',],
    'link': ['https://panel.holoviz.org/', 'https://discourse.holoviz.org/', 'https://github.com/holoviz/panel']*3,
}
df = pd.DataFrame(data)

pn.pane.Perspective(df, width=1000)
Try interacting with the Perspective pane.
The three vertical dots in the upper, left corner will toggle the configuration menu
The three vertical lines at the top of each column will toggle a column configuration menu.
The top menu will provide you with options to change the plugin as well as group, split, order and filter your data
The bottom menu will provide you with options to reset, download and copy as well as change the theme
The index is shown by default. If you want to not display it by default, you can provide the list of columns to display.
pn.pane.Perspective(df, columns=list(df.columns), width=1000)
You might also hide the config menu via the settings parameter.
pn.pane.Perspective(df, columns=["float"], group_by=["category"], plugin='d3_y_bar', settings=False, width=1000, height=300)
Try interacting with the Perspective pane by toggling the config menu via the 3 vertical dots in the upper, left corner.
Plugin Configuration#
You can configure the active plugin manually as shown for the Datagrid below
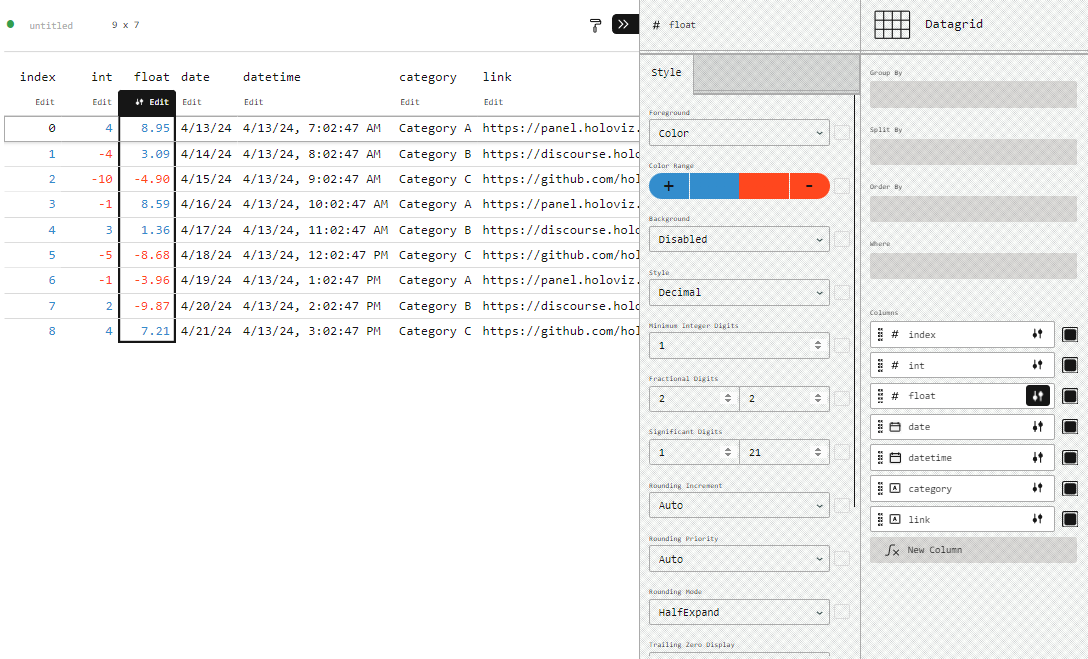
You can also configure the columns configuration programmatically via the columns_config parameter
pn.pane.Perspective(df, columns=list(df.columns), width=1000, columns_config={
    'int': {'number_fg_mode': 'color', 'neg_fg_color': '#880808', 'pos_fg_color': '#008000', "fixed": 0},
    'float': {'number_fg_mode': "bar", 'neg_fg_color': '#880808', 'pos_fg_color': '#008000', 'fg_gradient': 7.93,  },
    'category': {'string_color_mode': 'series', 'format': 'italics'},
    'date': {"dateStyle": "short", "datetime_color_mode": "foreground", "color": "#008000"},
    'datetime': {"timeZone": "Asia/Shanghai", "dateStyle": "full", "timeStyle": "full", "datetime_color_mode": "background", "color": "#880808"},
    'link': {'format': 'link', 'string_color_mode': 'foreground', 'color': '#008000'},
})
Please note
You can also use named colors like ‘green’ when you provide the
plugin_config. But if you do, then they will not be set in the color picker in the column config menu.
For more detail about the available options see the Column Configuration Options Section below.
Timezone Handling#
The underlying Perspective Viewer assumes non-timezone aware datetimes are in UTC time. And it displays them in your local time zone by default.
If your data is not time-zone aware you can make them. My servers time zone is ‘cet’ and I can make them aware as shown below.
df_aware = df.copy(deep=True)
df_aware['datetime'] = df_aware['datetime'].dt.tz_localize("CET")
pn.Column(df_aware.head(3), pn.pane.Perspective(df_aware, columns=list(df.columns), width=1000))
As shown in the section above you can then force the datetimes to be shown in a specific timezone.
pn.pane.Perspective(df_aware, width=1000, columns=list(df.columns), plugin_config={'columns': {'datetime': {"timeZone": "Europe/London", "timeStyle": "full"}}})
Streaming and Patching#
The Perspective pane also supports stream and patch methods allowing us to efficiently update the data
df_stream = pd.DataFrame(np.random.randn(400, 4), columns=list('ABCD')).cumsum()

stream_perspective = pn.pane.Perspective(
    df_stream, plugin='d3_y_line', columns=['A', 'B', 'C', 'D'], theme='pro-dark',
    sizing_mode='stretch_width', height=500, margin=0
)

stream_perspective
Lets start the streaming.
The amount of data to keep in the streaming buffer can be controlled via the rollover option:
rollover = pn.widgets.IntInput(label='Rollover', value=500)

def stream():
    data = df_stream.iloc[-1] + np.random.randn(4)
    stream_perspective.stream(data, rollover.value)

cb = pn.state.add_periodic_callback(stream, 50)

pn.Row(cb.param.period, rollover)
Alternatively we can also patch the data:
mixed_df = pd.DataFrame({'A': np.arange(10), 'B': np.random.rand(10), 'C': [f'foo{i}' for i in range(10)]})

perspective = pn.pane.Perspective(mixed_df, columns=list(mixed_df), height=500)

perspective
The easiest way to patch the data is by supplying a dictionary as the patch value. The dictionary should have the following structure:
{
    column: [
        (index: int or slice, value),
        ...
    ],
    ...
}
As an example, below we will patch the ‘A’ and ‘C’ columns. On the 'A' column we will replace the 0th row and on the 'C' column we replace the first two rows:
perspective.patch({'A': [(0, 3)], 'C': [(slice(0, 1), 'bar')]})

perspective
Deleting rows can be achieved by streaming the data you want to become visible and setting rollover equal to the row count of new data. Effectively, deleting old rows. Removing specific rows by index in a similar manner as patching is currently not supported.
data = {'A': np.arange(10)}

perspective = pn.pane.Perspective(data, height=500)

perspective
smaller_data = {'A': np.arange(5)}

perspective.stream(smaller_data, rollover=5)
Controls#
The Perspective pane exposes a number of options which can be changed from both Python and Javascript.
component = pn.pane.Perspective(df, columns=list(df.columns), width=1000)
pn.Row(component.controls(), component, height=800)
Plugin and Column Configuration Options#
The plugin and column configurations options of the underlying FinOS Perspective viewer are not well documented. The best way to find them is
Exploring interactively via a Controls widget like the one above.
Exploring the Perspective Examples Gallery.
Reverse engineering them from the Perspective GitHub repository.
For example for the
Datagridplugin, the options for configuring a number column are defined in number_column_style.rs.
Below we list some of the most useful options we have been able to find and seen working.
columns_config#
The Perspective API documentation does provide types for most configuration options:
bg_gradient?	number
color?	string
date_format?	DateFormat
datetime_color_mode?	"foreground" | "background"
fg_gradient?	number
fixed?	number
format?	"link" | "image" | "bold" | "italics" | "custom"
neg_bg_color?	string
neg_fg_color?	string
number_bg_mode?	"color" | "gradient" | "pulse" | "disabled"
number_fg_mode?	"color" | "bar" | "disabled"
number_format?	NumberFormat
pos_bg_color?	string
pos_fg_color?	string
string_color_mode?	"foreground" | "background" | "series"
symbols?	Record<string, string>
Datagrid#
Datetime Column (source)#
timeZone: (A valid time zone like ‘Africa/Tunis’, ‘Asia/Shanghai’, ‘Europe/Berlin’ etc.)dateStyle: (‘full’, ‘long’, ‘medium’, ‘short’, ‘disabled’)timeStyle: (‘full’, ‘long’, ‘medium’, ‘short’, ‘disabled’)datetime_color_mode(‘foreground’, ‘background’)color(str)
Number Column (Source)#
Precision:
fixed(int)
Foreground:
number_fg_mode(‘disabled’, ‘color’, ‘bar’)pos_fg_color(hex string),neg_fg_color(hex string),fg_gradient(float)
Background:
number_bg_mode(‘disabled’, ‘color’, ‘gradient’, ‘pulse’)pos_bg_color(str),neg_bg_color(str),bg_gradient(float)
String Column (source)#
string_color_mode: (‘background’, ‘foreground’, ‘series’)color(str)
format: (‘bold’, ‘link’, ‘italics’)The source code also exposes an ‘image’ option. But I’ve not been able to get it working. If you can please let us know.
Open this notebook in Jupyterlite | Download this notebook from GitHub (right-click to download).

