PythonAnywhere#
PythonAnywhere is a cloud-based Python development and hosting environment that lets you write, run, and deploy Python code directly in your browser. It includes an online editor, console, and web app hosting, making it easy to build and share Python applications without needing to set up local infrastructure.
As of September 2025:
Deploying ASGI and websocket-based apps (such as Panel) is in Beta stage and has a few limitations, the main one being that the user interface is very limited compared to their existing interface for WSGI apps (e.g. Django). They offer instead a command-line tool (that we will use in this how-to) and an API to manage the deployment of ASGI/websocket-based apps. Find more information on this page.
The Beginner Free Tier is not sufficient to deploy a Panel app (not enough disk space is made available to install an environment), see their Pricing page for more information (the Hacker Tier costs $5/month).
Create an app#
Create an account and log in.
We recommend following the interactive onboarding tutorials offered to you after the first login, they’re a nice way to explore the platform and its features.
Generate an API token by following the instructions on this page. This is required to run the
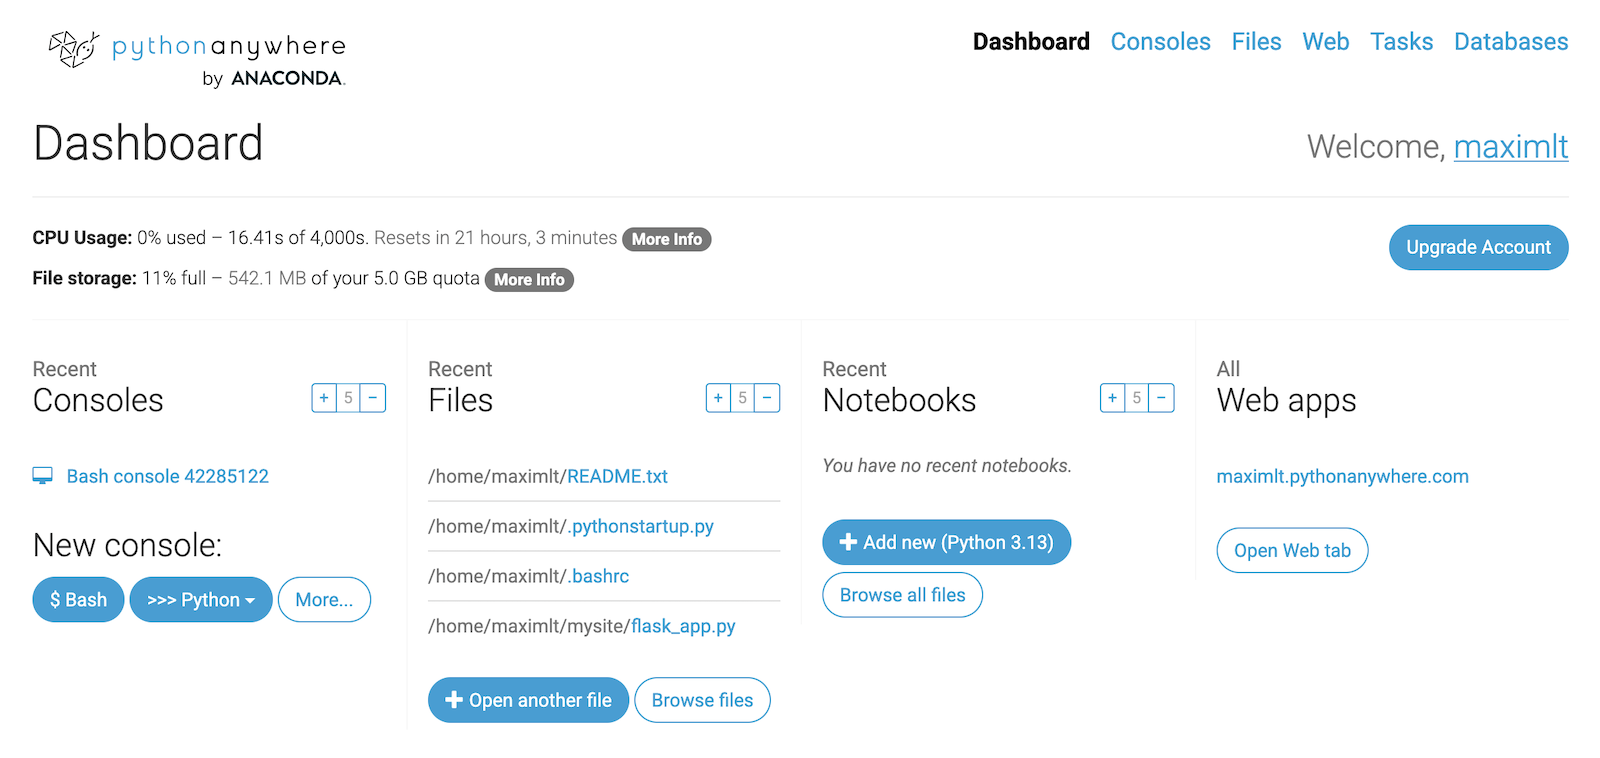
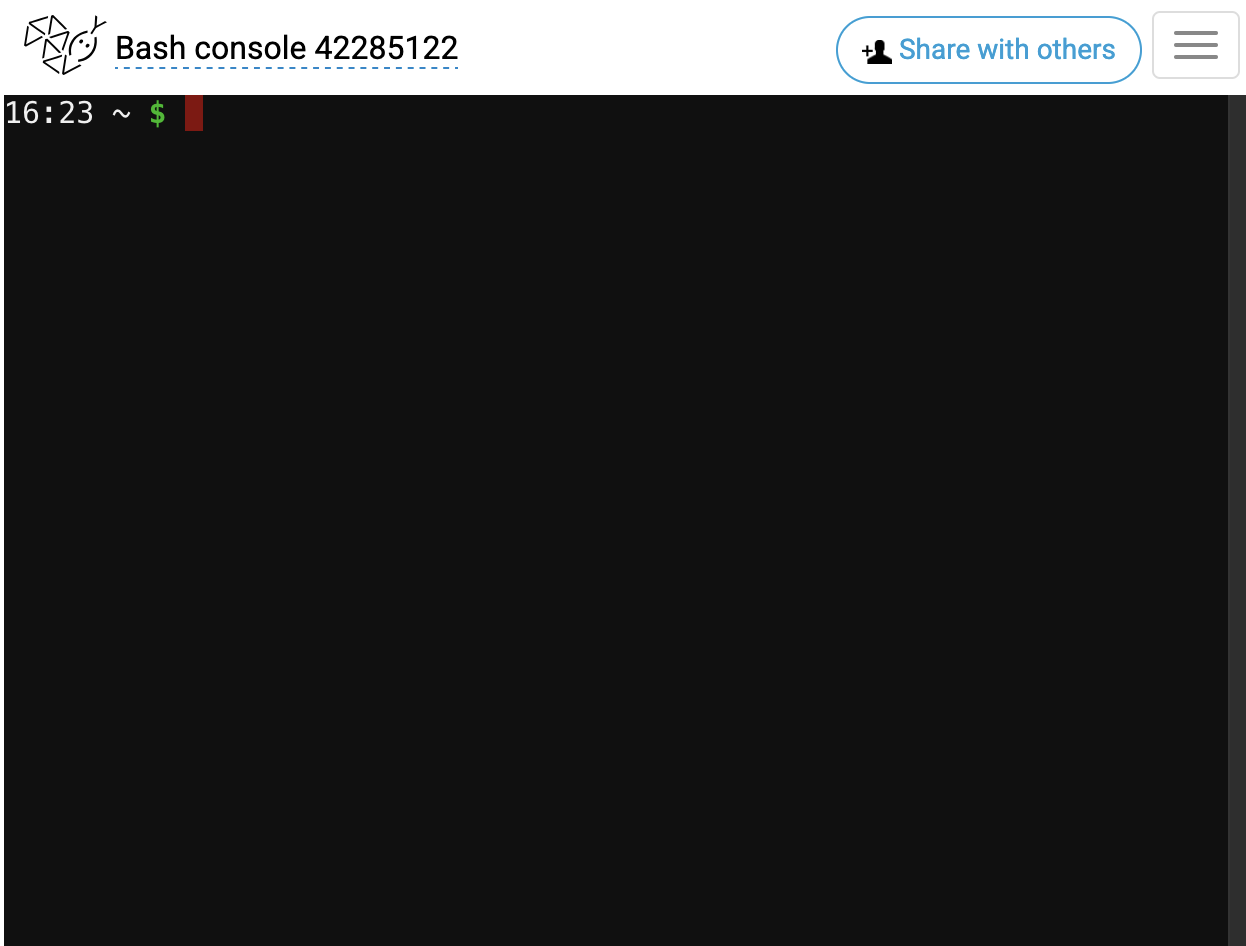
pacommand line tool we will install later to deploy a Panel app.Visit your “Dashboard” and open a “Bash” console.
Install the latest version of the
pacommand line tool by executingpip install --upgrade pythonanywhereCreate a Python virtual environment with this helper command
mkvirtualenv my_venv --python=python3.13(choose the Python version you prefer).Install Panel and the other dependencies you need for your app. For our example, we will run
pip install panel pandas plotly.Create a directory in which you’ll save the Panel app file with
mkdir ~/panel_app.Add your app file. In this example, we run
nano panel_app/app.py, copy/paste the code below, save and close the editor.
Portfolio Analysis app code for PythonAnywhere
Copy the code below:
import pandas as pd
import plotly.express as px
import plotly.graph_objects as go
import panel as pn

pn.extension('plotly', 'tabulator')

ACCENT = "#BB2649"
RED = "#D94467"
GREEN = "#5AD534"
LINK_SVG = """
<svg xmlns="http://www.w3.org/2000/svg" width="16" height="16" fill="currentColor" class="bi bi-arrow-up-right-square" viewBox="0 0 16 16">
  <path fill-rule="evenodd" d="M15 2a1 1 0 0 0-1-1H2a1 1 0 0 0-1 1v12a1 1 0 0 0 1 1h12a1 1 0 0 0 1-1V2zM0 2a2 2 0 0 1 2-2h12a2 2 0 0 1 2 2v12a2 2 0 0 1-2 2H2a2 2 0 0 1-2-2V2zm5.854 8.803a>
</svg>
"""

CSV_URL = "https://datasets.holoviz.org/equities/v1/equities.csv"

EQUITIES = {
    "AAPL": "Apple",
    "MSFT": "Microsoft",
    "AMZN": "Amazon",
    "GOOGL": "Alphabet",
    "TSLA": "Tesla",
    "BRK-B": "Berkshire Hathaway",
    "UNH": "United Health Group",
    "JNJ": "Johnson & Johnson",
}

EQUITY_LIST = tuple(EQUITIES.keys())

@pn.cache(ttl=600)
def get_historical_data(tickers=EQUITY_LIST, period="2y"):
    """Downloads the historical data from Yahoo Finance"""
    return pd.read_csv(CSV_URL, index_col=[0, 1], parse_dates=['Date'])

historical_data = get_historical_data()

def last_close(ticker, data=historical_data):
    """Returns the last close pricefor the given ticker"""
    return data.loc[ticker]["Close"].iloc[-1]

summary_data_dict = {
    "ticker": EQUITY_LIST,
    "company": EQUITIES.values(),
    "info": [
        f"""<a href='https://finance.yahoo.com/quote/{ticker}' target='_blank'>
        <div title='Open in Yahoo'>{LINK_SVG}</div></a>"""
        for ticker in EQUITIES
    ],
    "quantity": [75, 40, 100, 50, 40, 60, 20, 40],
    "price": [last_close(ticker) for ticker in EQUITIES],
    "value": None,
    "action": ["buy", "sell", "hold", "hold", "hold", "hold", "hold", "hold"],
    "notes": ["" for i in range(8)],
}

summary_data = pd.DataFrame(summary_data_dict)

def get_value_series(data=summary_data):
    """Returns the quantity * price series"""
    return data["quantity"] * data["price"]

summary_data["value"] = get_value_series()

titles = {
    "ticker": "Stock Ticker",
    "company": "Company",
    "info": "Info",
    "quantity": "Shares",
    "price": "Last Close Price",
    "value": "Market Value",
    "action": "Action",
    "notes": "Notes",
}
frozen_columns = ["ticker", "company"]
editors = {
    "ticker": None,
    "company": None,
    "quantity": {"type": "number", "min": 0, "step": 1},
    "price": None,
    "value": None,
    "action": {
        "type": "list",
        "values": {"buy": "buy", "sell": "sell", "hold": "hold"},
    },
    "notes": {
        "type": "textarea",
        "elementAttributes": {"maxlength": "100"},
        "selectContents": True,
        "verticalNavigation": "editor",
        "shiftEnterSubmit": True,
    },
    "info": None,
}
widths = {"notes": 400}
formatters = {
    "price": {"type": "money", "decimal": ".", "thousand": ",", "precision": 2},
    "value": {"type": "money", "decimal": ".", "thousand": ",", "precision": 0},
    "info": {"type": "html", "field": "html"},
}
text_align = {
    "price": "right",
    "value": "right",
    "action": "center",
    "info": "center",
}
base_configuration = {
    "clipboard": "copy"
}
summary_table = pn.widgets.Tabulator(
    summary_data,
    editors=editors,
    formatters=formatters,
    frozen_columns=frozen_columns,
    layout="fit_data_table",
    selectable=1,
    show_index=False,
    text_align=text_align,
    titles=titles,
    widths=widths,
    configuration=base_configuration,
)

def style_of_action_cell(value, colors={'buy': GREEN, 'sell': RED}):
    """Returns the css to apply to an 'action' cell depending on the val"""
    return f'color: {colors[value]}' if value in colors else ''

summary_table.style.map(style_of_action_cell, subset=["action"]).set_properties(
    **{"background-color": "#444"}, subset=["quantity"]
)

patches = pn.widgets.IntInput(description="Used to raise an event when a cell value has changed")

def handle_cell_edit(event, table=summary_table):
    """Updates the `value` cell when the `quantity` cell is updated"""
    row = event.row
    column = event.column
    if column == "quantity":
        quantity = event.value
        price = summary_table.value.loc[row, "price"]
        value = quantity * price
        table.patch({"value": [(row, value)]})
        patches.value +=1

def candlestick(selection=[], data=summary_data):
    """Returns a candlestick plot"""
    if not selection:
        ticker = "AAPL"
        company = "Apple"
    else:
        index = selection[0]
        ticker = data.loc[index, "ticker"]
        company = data.loc[index, "company"]
    dff_ticker_hist = historical_data.loc[ticker].reset_index()
    dff_ticker_hist["Date"] = pd.to_datetime(dff_ticker_hist["Date"])
    fig = go.Figure(
        go.Candlestick(
            x=dff_ticker_hist["Date"],
            open=dff_ticker_hist["Open"],
            high=dff_ticker_hist["High"],
            low=dff_ticker_hist["Low"],
            close=dff_ticker_hist["Close"],
        )
    )
    fig.update_layout(
        title_text=f"{ticker} {company} Daily Price",
        template="plotly_dark",
        autosize=True,
    )
    return fig

def portfolio_distribution(patches=0):
    """Returns the distribution of the portfolio"""
    data = summary_table.value
    portfolio_total = data["value"].sum()
    fig = px.pie(
        data,
        values="value",
        names="ticker",
        hole=0.3,
        title=f"Portfolio Total $ {portfolio_total:,.0f}",
        template="plotly_dark",
    )
    fig.layout.autosize = True
    return fig

candlestick = pn.bind(candlestick, selection=summary_table.param.selection)
summary_table.on_edit(handle_cell_edit)
portfolio_distribution = pn.bind(portfolio_distribution, patches=patches)

template = pn.template.FastGridTemplate(
    title="Portfolio Analysis",
    accent_base_color=ACCENT,
    header_background=ACCENT,
    prevent_collision=True,
    save_layout=True,
    theme_toggle=False,
    theme='dark',
    row_height=160
)
template.main[0:3, 0:8]  = pn.pane.Plotly(candlestick)
template.main[0:3, 8:12] = pn.pane.Plotly(portfolio_distribution)
template.main[3:5, :]    = summary_table
template.servable()
Deploy an app#
In Bash, to deploy your website to your subdomain – that is, to yourusername.pythonanywhere.com if you’re on our US system, or yourusername.eu.pythonanywhere.com if you’re on the EU system – just run the following command.
pa website create --domain YOURUSERNAME.pythonanywhere.com --command '/home/YOURUSERNAME/.virtualenvs/my_venv/bin/panel serve /home/YOURUSERNAME/panel_app/app.py --unix-socket "${DOMAIN_SOCKET}" --use-xheaders --allow-websocket-origin YOURUSERNAME.pythonanywhere.com'
…with the four instances of YOURUSERNAME replaced by your actual username, but with everything else exactly as it is.
After a few seconds, your app will be live and running at YOURUSERNAME.pythonanywhere.com!
Note
You can also choose a custom subdomain of PythonAnywhere of the form something-yourusername.pythonanywhere.com, or set up your own custom domain name.
Manage an app#
Get the details for one app by running
pa website get --domain YOURUSERNAME.pythonanywhere.comIf you change the code of your app, you’ll need to reload it to activate those changes by running
pa website reload --domain YOURUSERNAME.pythonanywhere.comDelete your app with
pa website delete --domain YOURUSERNAME.pythonanywhere.com
